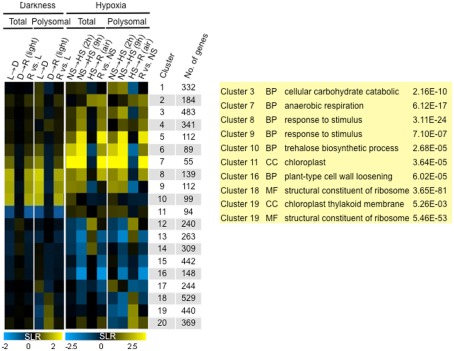
Figure 9.
Comparison of change in transcriptome and translatome mRNA abundance in response to light and oxygen availability. Fuzzy k-mean clustering analysis performed on 14 mean signal log ratio (SLR) comparisons of total and immunopurified polysomal mRNA transcript abundance. Genes included in the analysis were those without all “absent” calls in bioreplicates and significantly different increase or decrease in abundance (|SLR| ≥ 1; FDR <0.01; n = 5024 probe pair sets; Table S2A in Supplementary Material). The heatmap shows median SLR values for each of 20 clusters of mRNAs that displayed similar responses to light availability and low oxygen treatment based on the total and polysomal mRNA populations. Color indicates increase (yellow), decrease (blue), or no-change (black) in mRNA abundance. Columns indicate cluster ID, number of genes (No. genes). Dark/Light (L → D), Re-illumination/Dark (D → R), and Re-illumination/Light (R versus L), 2 h hypoxia/2 h non-stress [NS → HS (2 h)], 9 h hypoxia/9 h non-stress [(NS → HS (9 h)], 1 h recovery from 9 h hypoxia/9 h hypoxia [HS → R (air)], and 1 h recovery from 9 h hypoxia/9 h non-stress (R versus NS).

