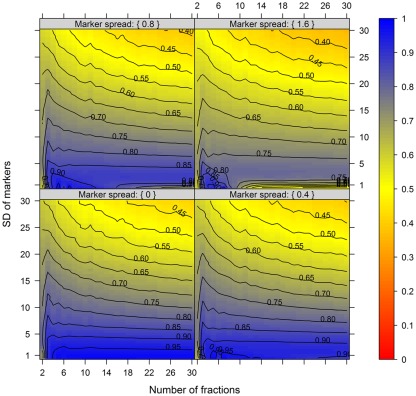
Figure 4.
The cluster validity in dependence of the number of collected fractions, the SD of markers, and the marker spread. While the SD modulates the between-compartmental separation, the marker spread modulates the within-compartmental cohesion (cf. Figure 3). The cluster validity index, estimated as mean–average of the Silhouette information and the Pearson’s matrix correlation, is depicted independent of compartments (3–5) as well as markers (2, 3, or 5) per compartment considered. The closer the value is to 1 the better the observed cluster validity, color-coded as depicted in the right-side bar. To aid visualization negative cluster validity values were set to 0 and contour lines were drawn for each 0.05 unit. More detailed graphs can be found as Figures A2–A4 in Appendix.

