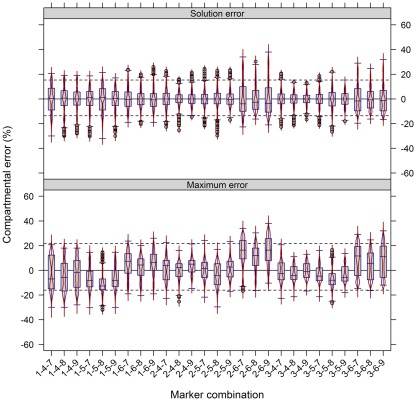
Figure 6.
Influence of compartment-specific marker combinations on estimated compartmental abundances based on experimental data. Combined box- and violin plots (red lines) showing the difference of the maximum and solution error based on compartmental abundances estimated using BFA as mean–average difference over the three independent gradients. While positive values indicate larger compartmental abundances when all nine markers were used, negative values depict larger abundances for a certain 3-marker combination. The 5th and 95th percentiles among all combinations are drawn as black dashed lines. Marker 1–3, 4–6, and 7–9 represent the plastids, the cytosol, and the vacuole, respectively. Plastids: 1 – glyceraldehyde-3-phosphate dehydrogenase (GAPDH), 2 – starch, 3 – Digalactosyldiacylglycerols (DGDGs); Cytosol: 4 – Uridine diphosphate – glucose-pyrophosphorylase (UGPase), 5 – glyceroceramids (GlcCer), 6 – triacylglycerides (TAGs); Vacuole: 7 – nitrate, 8 – glucosinolates, and 9 – flavonoids.

