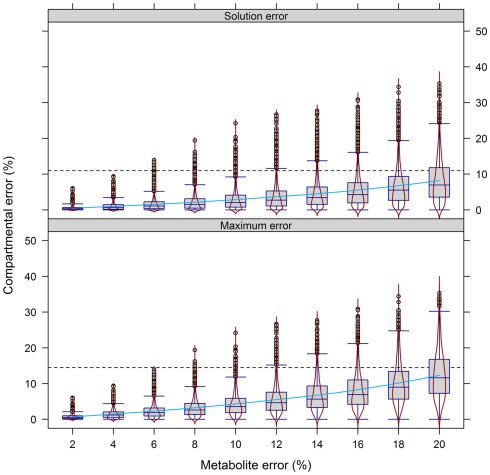
Figure 8.
Calculation error of compartmental abundances in dependence of the metabolite error based on experimental data. Compartmental abundances are estimated using BFA and visualized as absolute mean–average difference over the three independent gradients. The 95th percentile among all metabolite error levels is drawn as black dashed lines. The light-blue solid line shows a fitted smooth curve to illustrate the increase of the estimated compartmental error with increasing metabolite error.

