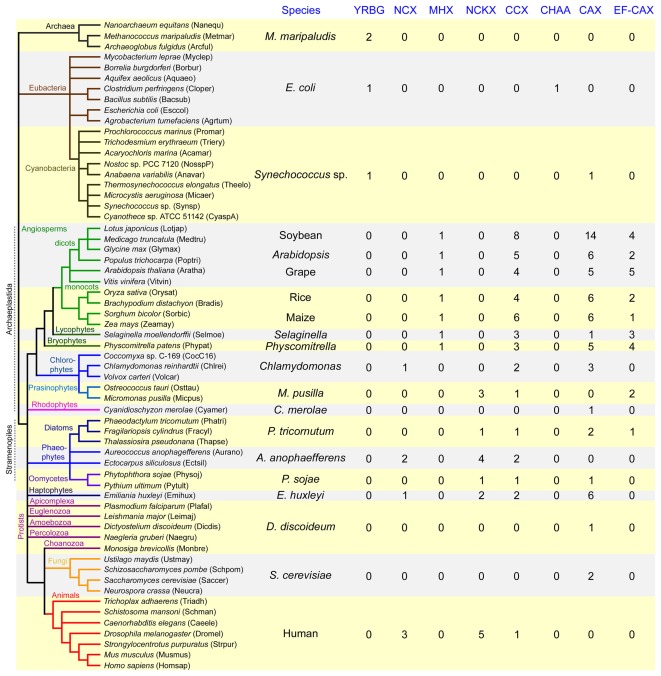
Figure 2.
Variation in the distribution of genes within each of the major CaCA gene families (YRBG, NCX, NCKX, CCX, CHAA, CAX) and sub-families (MHX, EF–CAX) across eukaryotic and prokaryotic organisms. Gene numbers determined by phylogenetic analysis from representative species for each of the classes of organisms examined are shown. The species from which CaCA genes were identified are listed (left hand side) with the species name abbreviation in parentheses. The evolutionary relationships of the species is shown, generated using iTOL (http://itol.embl.de) and based on the NCBI taxonomy tree. For the full gene distribution for each of the species analyzed see Table S1 in Supplementary Material.

