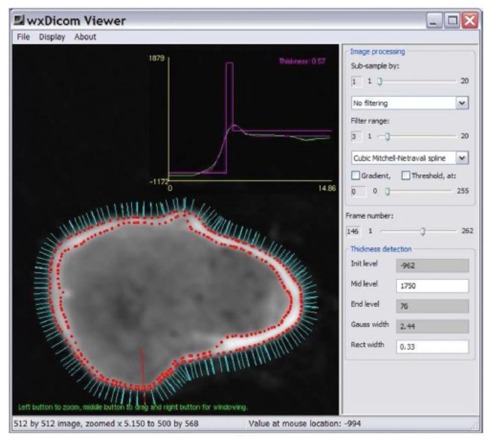
Figure 8.
Surface normals (cyan) around the neck of the right femur (imaged with CT), each of which can be used as a point for cortical thickness measurement; a single measurement is made at the point of the red line and displayed as the magenta peak in the graph above (0.57 mm). Image courtesy of Dr. Graham Treece, Department of Engineering, University of Cambridge.

