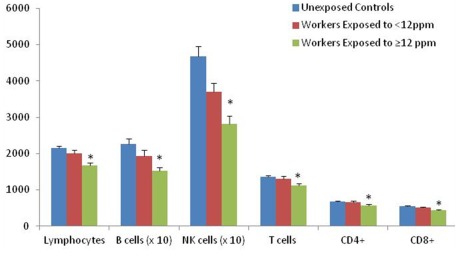
Figure 1.
Lymphocyte and lymphocyte subset counts (mean ± SE) among trichloroethylene (TCE) exposed workers and unexposed controls. Results previously reported in (Lan et al., 2010). Lymphocytes and lymphocyte subset counts in relation to TCE exposure level. Ptrend using category of TCE levels (controls, <12 and ≥12 ppm) as a continuous variable (*Ptrend < 0.05). The median TCE concentration of all exposed subjects was 12 ppm. Differences in cell counts were tested by linear regression analysis of ln-transformed end point, adjusting for relevant covariates [lymphocytes: adjusted for age and sex; CD4+, CD8+, and NK T cells: adjusted for age and sex, three subjects (two controls and one exposed) were deleted due to inconsistent cell counts using complete blood count data versus flow cytometry to calculate % lymphocytes; B cell: adjusted for age, sex, and smoking status].

