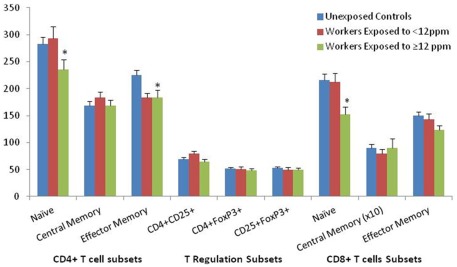
Figure 2.
T cell subset counts (mean ± SE) among trichloroethylene (TCE) exposed workers and unexposed controls. T cell lymphocyte subset counts in relation to TCE exposure level. Ptrend using category of TCE levels (controls, <12 and ≥12 ppm) as a continuous variable (*Ptrend < 0.05). The median TCE concentration of all exposed subjects was 12 ppm. Differences in cell counts were tested by linear regression analysis of ln-transformed end point, adjusting for relevant covariates [CD4+ central memory, T regulation subsets, CD8+ naïve, CD8+ central memory cells: adjusted for age, sex; CD4+ naïve cells: adjusted for age, sex, infection; CD4+ effector memory: adjusted for age, sex, smoking status; CD8+ effector memory: adjusted for age, sex, BMI]; *Ptrend < 0.05.

