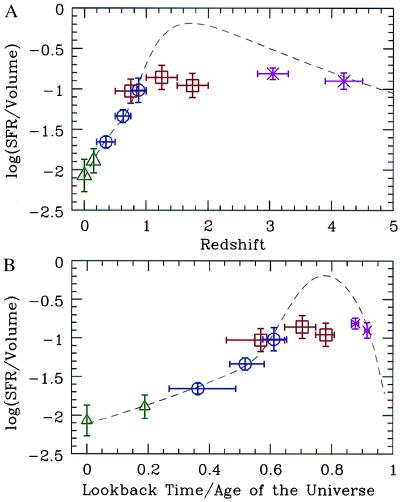
Figure 1.
A schematic diagram showing the current measurements of the star-formation history of the universe or, more properly, the energy emitted per unit volume, converted into a star formation rate (SFR; adapted from ref. 12). The same data are plotted in two different ways. (A) The SFR per unit volume is plotted against the redshift (the observable quantity). (B) The redshift is converted into a time axis and normalized to the age of the universe; the “lookback” time at the Big Bang is 1.0, such that observations now extend over ≈90% of the age of the universe. The data are from the references indicated: ▵ (13, 14), ○ (15), ▫ (16), and × (17). Essentially all of the data have been published in the last 3 years. The dashed curves represent one of many possible star-formation histories that is consistent with the current data on the far-IR backgrounds and with galaxies detected in the new submillimeter window (18). Note that the cosmic time interval beyond a redshift of z ≈ 4.5 is so limited that it is unlikely that star formation at still higher redshifts can have a large effect on the integrated production of stars over the history of the universe. All of the points beyond z = 1 or a lookback time of ≈60% of the age of the universe are based on samples selected by using photometric methods, one of which is described in Fig. 2.

