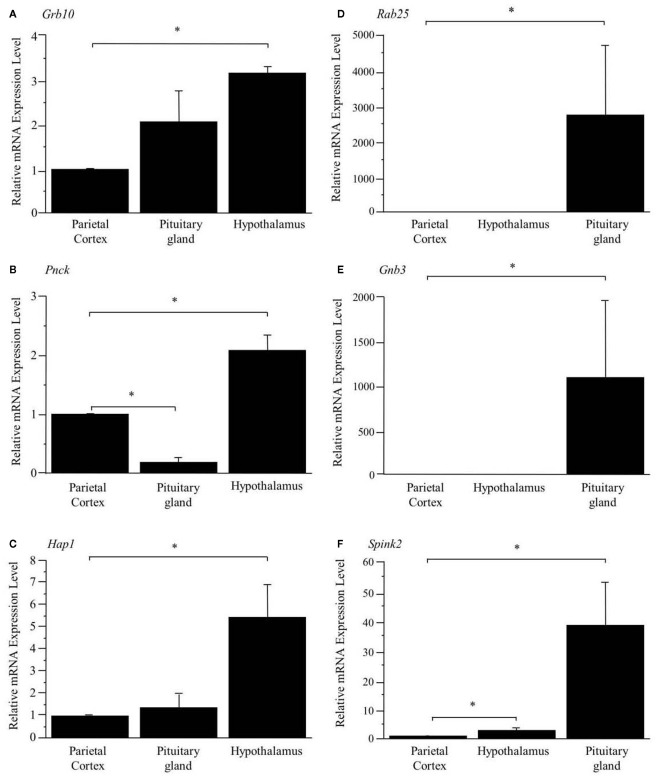
Figure 1.
Confirmation of preferentially expressed genes in the hypothalamus (A–C) and pituitary gland (D–F). The expression levels are normalized to Hprt and are shown as fold difference compared with the parietal cortex. *Represents a significant difference compared to the parietal cortex (p < 0.05). Data are represented as mean ± SE.

