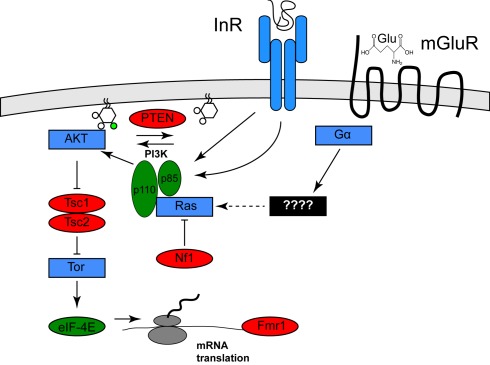
Figure 1.
Activation of the Pi3K/Tor pathway by insulin and glutamate. The relationships among the genes described in the text are shown. Proteins shown in red are PI3K/Tor pathway inhibitors, and autism is associated with loss of function mutation in these genes, whereas the proteins shown in green are PI3K/Tor pathway activators and autism is associated with gain of function alterations in these genes. Proteins shown in blue represent other pathway activators. For clarity, several molecular intermediates are omitted. See Hay and Sonenberg (2004) for a more complete molecular description of this pathway.

