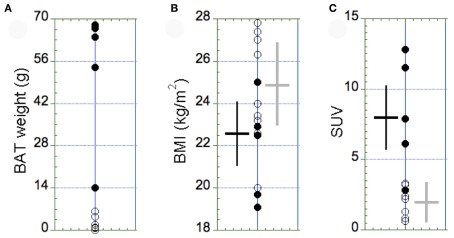
Figure 3.
Distribution of the amount of BAT (A), the BMI (B), and the maximal SUV in BAT (C) in the BAT+ group (full circles, N = 5) and in the BAT− group (open circles, N = 9). (A) The amount of BAT was highly variable, with most of the subjects displaying <10 g of active BAT in small supraclavicular depots. Accordingly, subjects with >10 g of active BAT were assigned to the BAT+ group. (B) The BMI was similar between the two groups (p = 0.38). (C) In contrast, the maximal SUV in BAT observed in the BAT+ group was significantly higher than in the BAT− group (p = 0.03). The error bars in (B,C) represent SD of the measurements.

