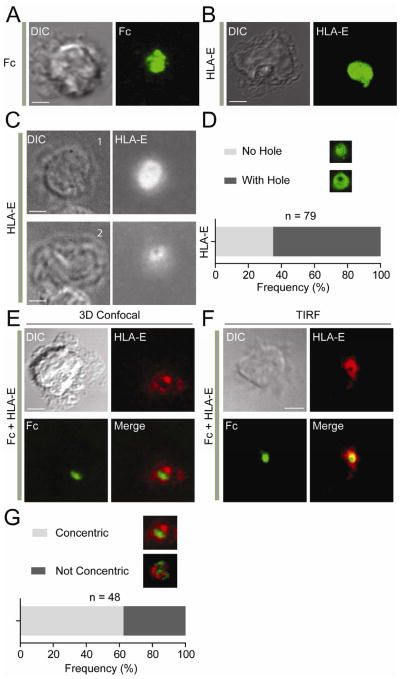
Figure 1. Inhibitory NK Cell Immunological Synapses Formed with IgG1 Fc and HLA-E.
(A and B) Three-dimensional confocal images of fixed NK cells over lipid bilayers carrying Fc-Alexa Fluor 488 (A) and HLA-E-Alexa Fluor 488 (B). (C) TIRF image of two different fixed NK cells over a lipid bilayer carrying HLA-E-Alexa Fluor 568. Cell #1 shows HLA-E clustering without hole. Cell #2 shows HLA-E clustering with a central hole. The frequency of each type of clustering is shown in (D). (E) Three-dimensional confocal images of fixed NK cells over bilayers carrying HLA-E-Alexa Fluor 568 (Red) and Fc-Alexa Fluor 488 (Green). (F) TIRF image of a live NK cell over a bilayer carrying HLA-E-Alexa Fluor 568 (Red) and Fc-Alexa Fluor 488 (Green). (G) Frequency of organized, concentric synapses versus disorganized synapses. Scale bars are 3.0 μm. NK cells were fixed about 60 min after addition to bilayers. The images are representative of at least 100 cells for TIRF images and 48 cells for 3D confocal images in three independent experiments.

