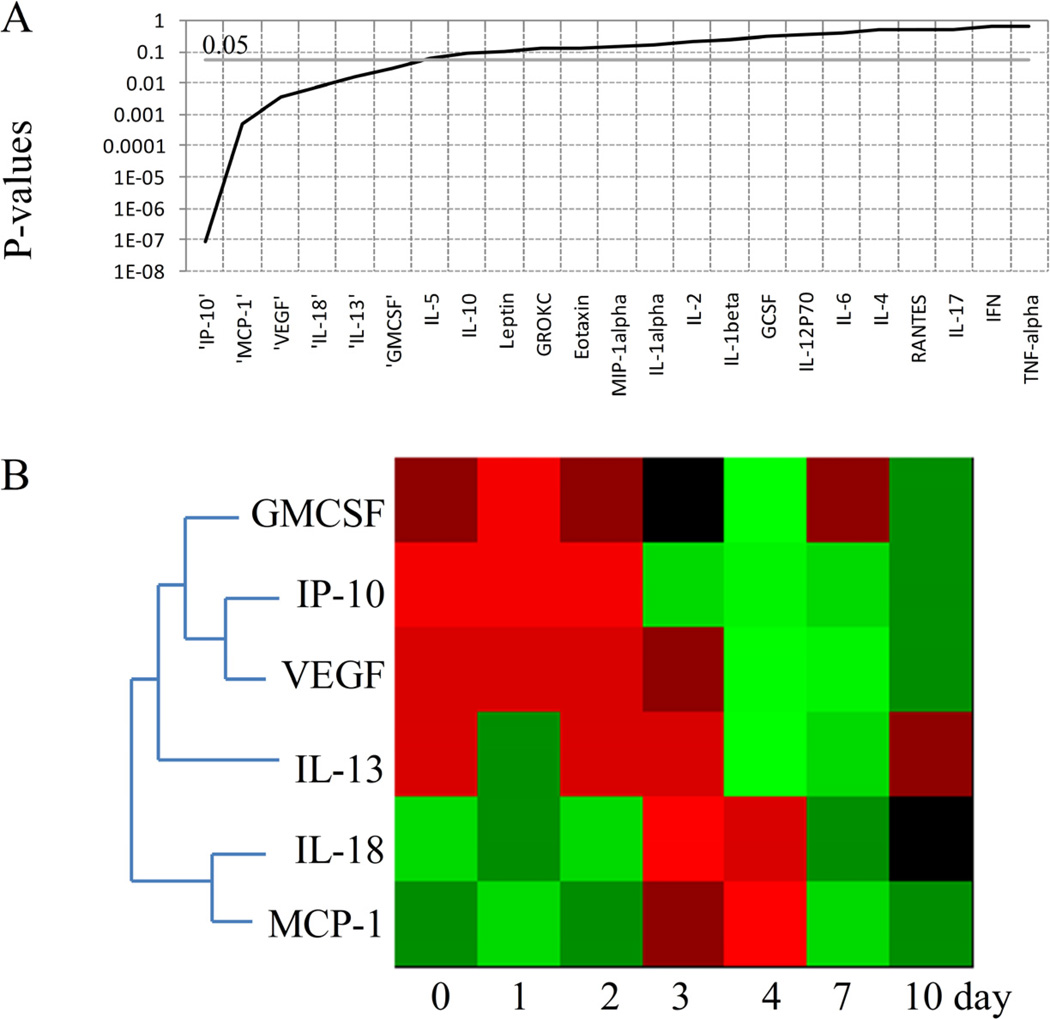
Figure 4.
Chemokines and cytokines showing significant changes across the time in S+CLP group.A. P values of cytokines and chemokines obtained by ANOVA test. B. Heat map of cytokines and chemokines significantly changed across the time (P<0.05). Green indicates the lowest level while red indicates the highest and black average level.

