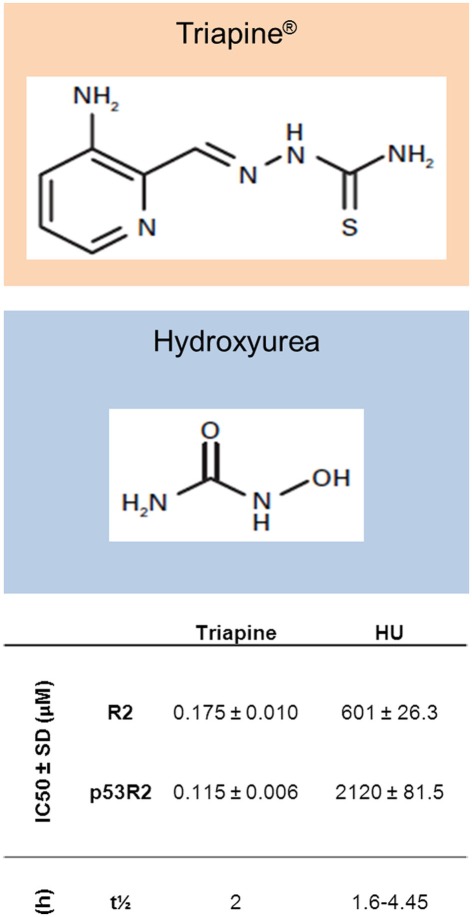
Figure 2.
Structures of Triapine® and hydroxyurea, with in vitro and pharmacokinetic data. Shown are IC50 (concentration of compounds producing 50% inhibition of recombinant RR activity) values for both compounds in an in vitro RR activity assay with R2 or p53R2 bound to R1 (Zhu et al., 2009). Also shown are elimination half-lives (t1/2) for both compounds (Gwilt and Tracewell, 1998; Kunos et al., 2010b).

