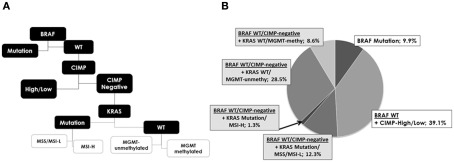
Figure 4.
(A) Analysis of the five molecular features using classification and regression tree analysis shows the hierarchy of most discriminating alterations and prognostic subgroups, namely subgroup 1: BRAF mutation, subgroup 2: CIMP-high, and CIMP-low and subgroup 3: CIMP-negative. KRAS, MGMT, and MSI contribute only little additional prognostic information. (B) Frequencies of each new subgroup.

