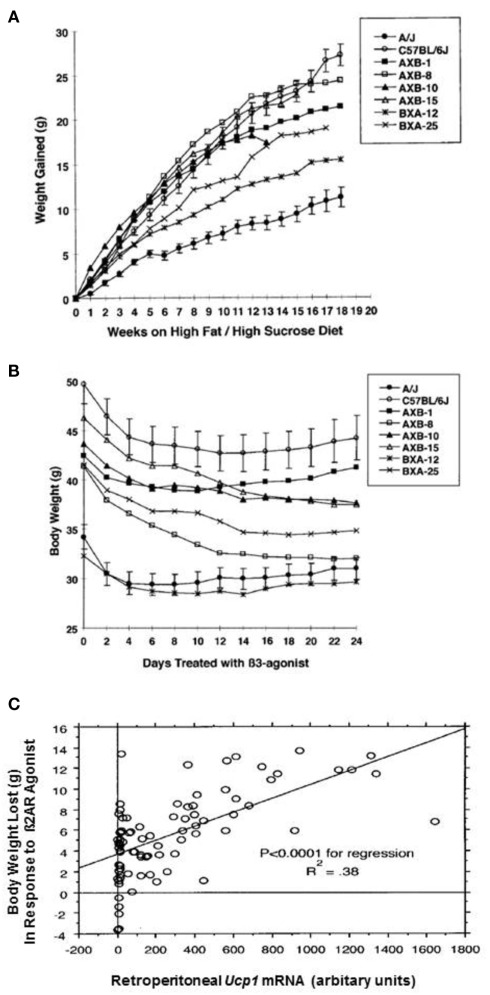
Figure 3.
(A) Body weight gained by parental and RI strains fed a high fat/high sucrose diet (Research Diets 12331) starting at 7 week of age and continuing for 18 week. (B) After 18 week, mice continued to be fed the high fat/high sucrose diet and were also treated with the β3-adrenergic agonist, CL 316,243, as described (Guerra et al., 1998). Changes in body weight are shown. The mean ± SE for the B6 and A/J parental strains are shown, whereas only the means have been plotted for the RI stains. The number of mice in each group ranges from 9 to 12. (C) Regression analysis to evaluate the effects of Ucp1 mRNA in the retroperitoneal fat on body weight loss. P is an estimator of the significance of the regression. R2 is the coefficient of determination; it is the proportion of the dependent variable that is explained by the independent variable. N was 86.

