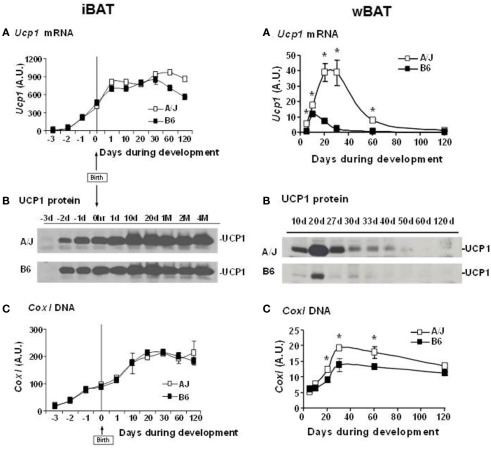
Figure 8.
(A) Development of iBAT in A/J and B6. (A) Ucp1 mRNA, (B) UCP1 protein, and (C) mitochondrial DNA content in iBAT of A/J and B6 mice during perinatal and postnatal development. For Ucp1 mRNA, each time point gives the average value from 4 to 9 individual animals analyzed in duplicate and is expressed relative to cyclophilin. Cox1 mitochondrial DNA levels are expressed relative to the nuclear gene Ucp2 from the analysis of four mice in duplicate. (B). Induction of UCP1 in RP white fat depot in A/J and B6 during postnatal development. (A) Ucp1 mRNA, (B) UCP1 protein, and (C) mitochondrial DNA content in RP of A/J and B6 during postnatal development. *P < 0.05 vs. B6. Ucp1 mRNA and Cox1 DNA is based upon the analysis of three to six animals and Cox1 DNA of four mice per time point. Ucp1 mRNA is expressed relative to cyclophilin, while mitochondrial Cox1 DNA is reported relative to Ucp2.

