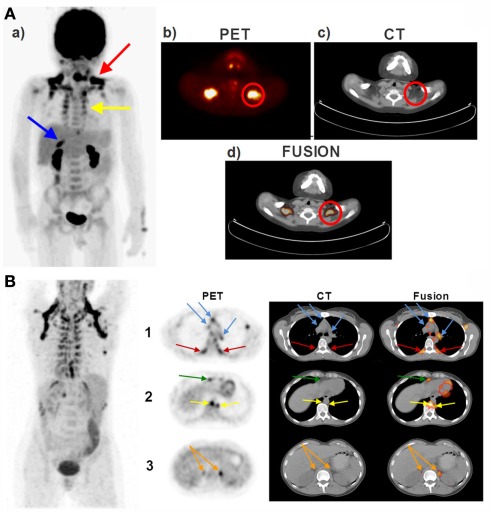
Figure 1.
Brown adipose tissue (BAT) distribution in a pediatric (A) and adult (B) human. (A) The PET/CT scans of a 5-year-old boy taken 60 min after an i.v. injection of 5 mCi 18FDG. Red arrow shows the supraclavicular BAT, yellow arrow shows the peri-spinal BAT depots and blue arrow shows the peri-adrenal BAT depot in (a) coronal view (postero-anterior projection). The Supraclavicular BAT is also illustrated in a transversal series of (b) PET, (c) CT, and (d) fusion views of the cervical–supraclavicular region. Red circles denote the supraclavicular BAT in (b–d). (B) The PET/CT scans of a 35-year-old woman taken 60 min after an i.v. injection of 5 mCi 18FDG. First row shows the transversal section of the aortic arch. Red arrows denote the peri-spinal BAT depots and the blue arrows point to the mediastinal BAT depots on PET (left panel), CT (middle panel), and fusion scans (right panel). Second row shows the transversal section of the hepatocardiac section, where yellow arrows point to the peri-aortic BAT depots and the green arrow points to the pericardial BAT depots. Third row shows the transversal section of the adrenal gland, where orange arrows point to the peri-adrenal BAT depots. PET/CT, positron emission tomography/computed tomography; 18FDG, 18fluorodeoxyglucose; i.v., intravenous; BAT, brown adipose tissue.

