Figure 2.
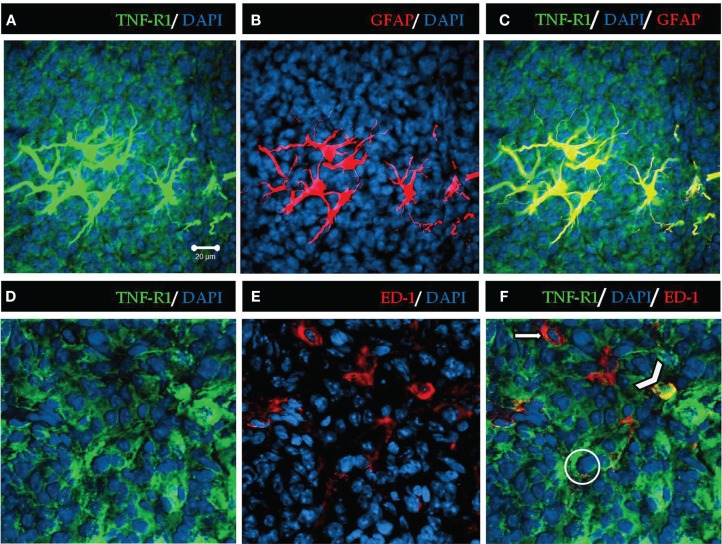
High magnification of TNF-R1 expression in rat pineal sections. TNF-R1 is stained in green, showing positive immunoreactivity throughout the pineal parenchyma (A,C,D,F). The glial cells were stained in red with GFAP for astrocytes and ED-1 for microglia (B,E). Astrocytes (B) are confined to the proximal region of pineal gland. Microglia (E) present a diffuse pattern of distribution along the parenchyma. The blue staining represents nuclei stained by DAPI. The yellow merged images show positive co-localization of TNF-R1 in astrocytes (C) and microglia (F). The filled arrow (F) indicates that microglia (red) are negative for TNF-R1, and the arrowhead shows positive co-localization between microglia and TNF-R1 (yellow). The circle shows a pinealocyte expressing TNF-R1 (green). Scale bar = 20 μm

