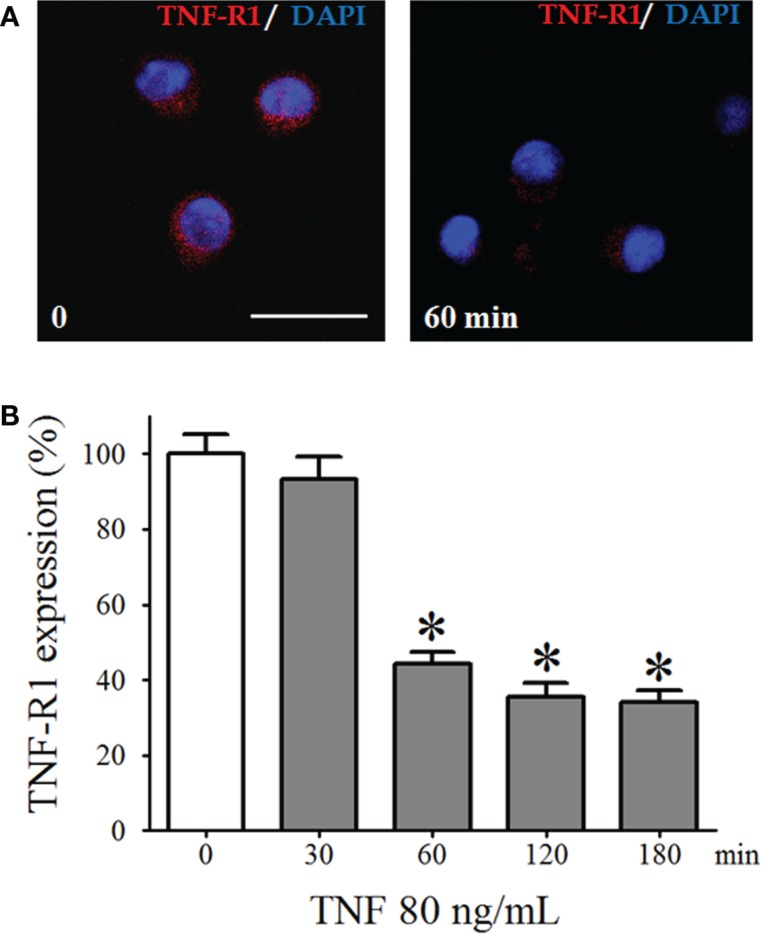
Figure 3.
The TNF-R1 expression in dispersed pinealocytes. (A) Representative immunocytochemistry images of cultured pinealocytes showing the constitutive expression of TNF-R1 (stained in red, left-hand side). Incubation with TNF (80 ng/mL) for 60 min reduces the detection of TNF-R1 (right-hand side). Blue staining represents fluorescent nuclei stained using DAPI. (B) Quantification of the fluorescence of pinealocytes stimulated (gray bars) or not stimulated (white bars) with TNF (80 ng/mL) for 30–180 min. Data are expressed as the mean ± SEM; n = 4 independent cultures. In each well, we counted 21 cells in three different, randomly chosen fields. *p < 0.05 vs. no TNF. Scale bar = 20 μm.

