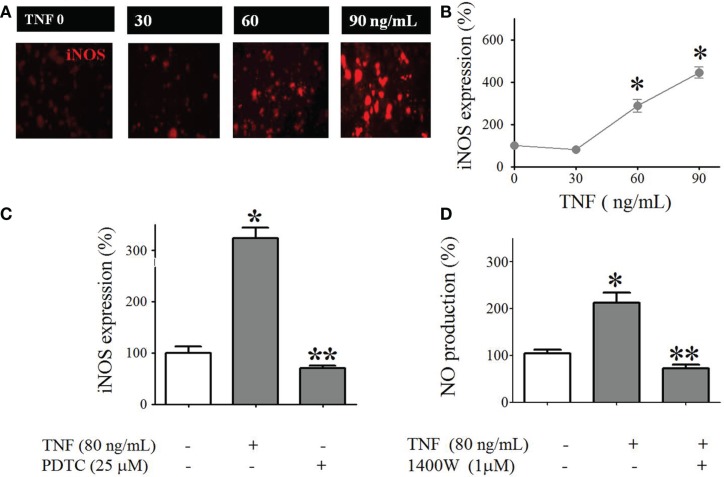
Figure 8.
Tumor necrosis factor-induced iNOS expression and NO production in cultured pinealocytes. (A) Representative immunocytochemistry images showing staining against iNOS (red) in pinealocytes stimulated or not stimulated with TNF (30–90 ng/mL for 120 min). (B) Quantification of the fluorescence intensity. (C) TNF (120 min)–induced iNOS expression is inhibited by PDTC (25 μM). (D) TNF (120 min)–induced NO production in cultured pinealocytes is inhibited by 1400 W (1 μM). Data are expressed as the mean ± SEM; n = 3 independent experiments per parameter. *p < 0.05 vs. no TNF (white bar); **p < 0.05 when comparing the groups stimulated with TNF in the presence or absence of 1400 W (C) or PDTC (D).

