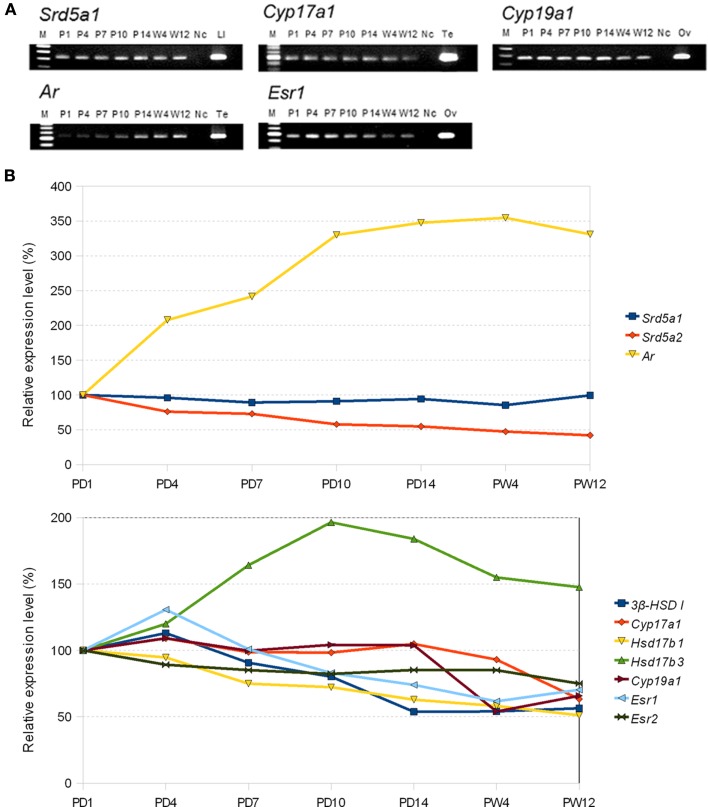
Figure 6.
(A) Typical electrophoresis gel images for the RT-PCR analysis for the mRNAs of sex-steroidogenic enzymes (Srd5a1: 5α-reductase type 1, Cyp17a1: P450 (17α), and Cyp19a1: P450arom) and sex hormone receptors (Ar: AR and Esr1: ERα). Each band of PCR product is stained with EtBr and visualized. Lanes labeled with P1 (PD1), P4, P7, P10, P14, W4 (PW4), and W12 represent the PCR products derived from the male rat hippocampus at the corresponding ages. The left-most lane (labeled with M) is the DNA ladder marker lane. The right-most lane corresponds to the positive control derived from PW12 rats. Ad, adrenal; Li, liver; Ov, ovary; Te, testis. The lane Nc represents the negative control. (B) Comparison of relative expression level of sex-steroidogenic enzymes and receptors at P1 and 12 week. PD1 is set to be 100% for each gene. Abbreviations are, for example, P1 (postnatal day 1), W4 (4 week), and W12 (12 week). Modified from Kimoto et al. (2010).

