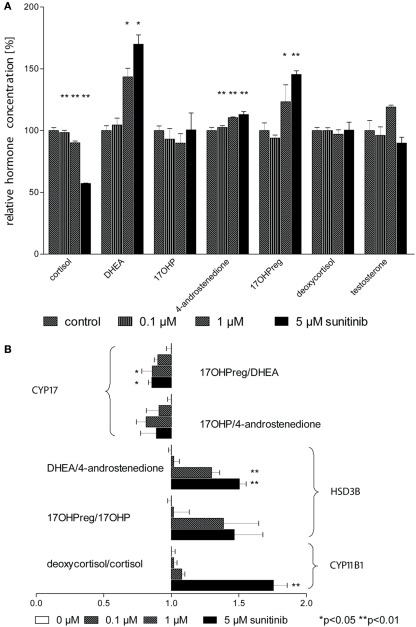
Figure 4.
Sunitinib leads to characteristic changes in steroid profiles. (A) Isotope dilution GC–MS was used to study changes in steroid profiles of NCI-H295 cell culture supernatants after incubation with sunitinib for 4 days. Individual values were normalized to control cells (100%). Cortisol concentration was diminished to 98 ± 2%** (0.1 μM), 90 ± 2%** (1 μM), and 57 ± 0.3%** (5 μM) of control (100 ± 2%) but DHEA increased to 105 ± 6%, 143 ± 7%*, and 170 ± 8%* respectively compared to control incubations (100.0 ± 3.9%). However, a less pronounced increase was found for 4-androstenedione to 103 ± 2%**, 111 ± 1%**, and 113 ± 2%** (4-androstenedione, control 100 ± 3%) and for 17OHPreg to 94 ± 2% (n.s.), 123.3 ± 13.7%* (1 μM), and 145.4 ± 3.0%** (5 μM). (B) Steroid ratios were calculated for four characteristic substrates and products of HSD3B (3β-hydroxylase), CYP17 (17,20-lyase), and CYP11B1 (11β-hydroxylase). *p < 0.05, **p < 0.01 compared to control.

