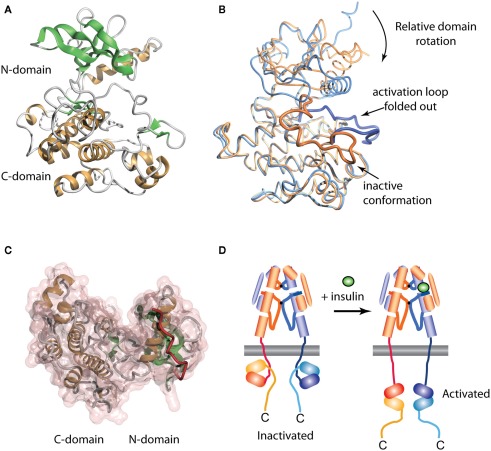
Figure 4.
Three-dimensional crystal structure of the insulin receptor tyrosine kinase domain. (A) Inactive form, showing the secondary structure of the N- and C-terminal domains. (B) Overlay of the inactive (blue, PDB entry 1IRK) and activated (orange, PDB entry 1IR3) forms of the domain, showing the displacement from the catalytic site of the activation loop (residues 1149–1170, highlighted as a thicker ribbon within each form) and the concomitant domain rotation which are observed upon activation. (C) Interaction between the juxtamembrane residues 978–988 (red tube) and the N-terminal domain of the IR tyrosine kinase in its basal state (transparent pink surface, PDB entry 1P14). (D) Stylized cartoon showing the hypothesized sequestered disposition of the kinase domain as a consequence of its interaction with the proximal region juxtamembrane segment [see (C)], followed by its release upon activation.

