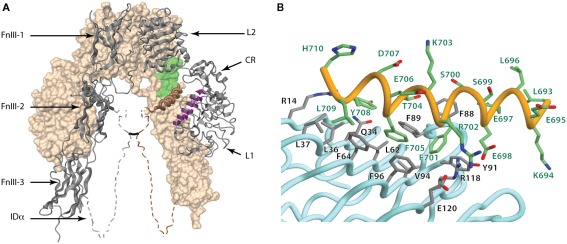
Figure 6.
(A) Three-dimensional crystal structure of the IR ectodomain, showing the inverted “V” conformation with respect to the membrane. The background monomer is shown in molecular surface representation (beige) and the foreground monomer in secondary structure schematic representation (gray) with the constituent domains labeled. The disordered portions of the α-chain components of the insert domain are shown as dashed and their conformation shown here is speculative, with the approximate location of the inter-chain disulfide being indicated by a black line. The relative location of the components that make up the insulin binding site within one leg of the inverted “V” are highlighted and include the surface of the central β-sheet of the L1 domain of one monomer (purple), residues at the junction of FnIII-1 and FnIII-2 domains of the adjacent monomer (light green) and the helix formed by the C-terminal segment of α-chain (brown coil). (B) Detail of the conformation of the αCT segment on the surface the central β-sheet of the L1 domain in the crystal structure of the apo-form of the insulin receptor ectodomain. The Figure is based on PDB entry 3LOH; (B) is from Smith et al. (2010), used by permission.

