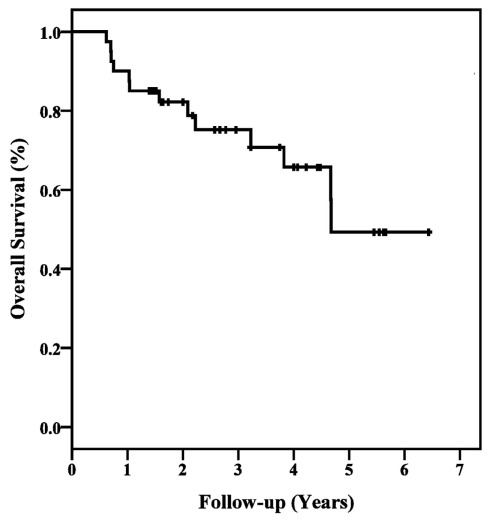
. 2012 Feb 1;2:9. doi: 10.3389/fonc.2012.00009
Copyright © 2012 Chen, Oermann, Vahdat, Rabin, Suy, Yu, Collins, Subramaniam, Banovac, Anderson and Collins.
This is an open-access article distributed under the terms of the Creative Commons Attribution Non Commercial License, which permits non-commercial use, distribution, and reproduction in other forums, provided the original authors and source are credited.

