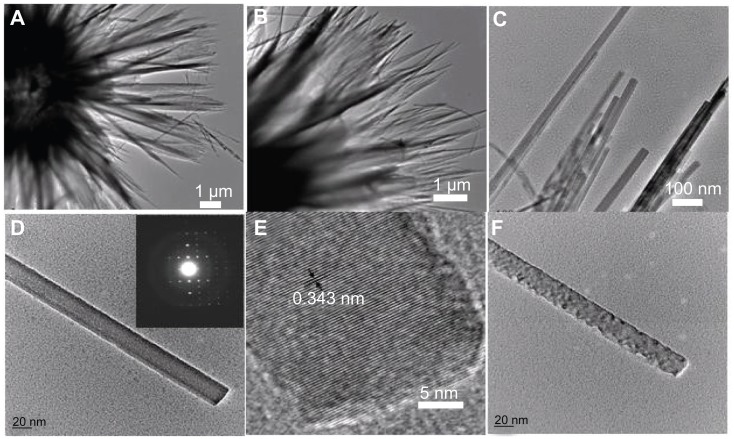
Figure 2.
TEM images of hierarchically nanostructured hydroxyapatite (sample 1): (A and B) the edges of the flower-like assembly; (C) the edges of the nanosheets; (D) an individual nanorod; (E) the corresponding high-resolution TEM micrograph of (D); and (F) the nanorod after exposure to electron beam irradiation. The inset of (D) shows the corresponding selected area electron diffraction pattern.
Abbreviation: TEM, transmission electron microscopy.

