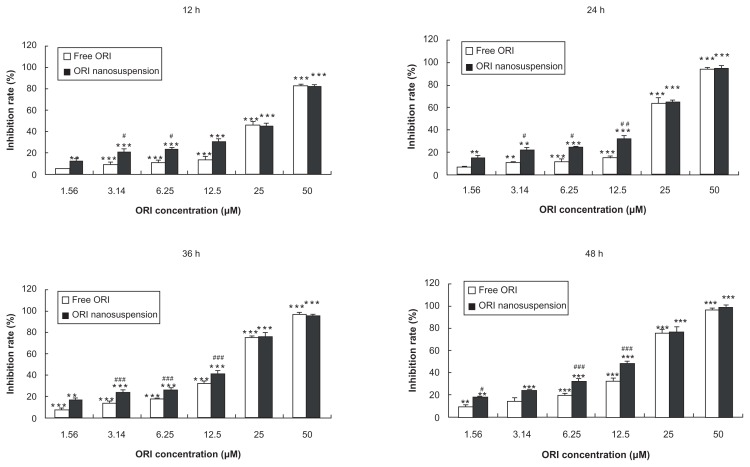
Figure 2.
Cytotoxic effects of oridonin nanosuspension and free oridonin on PANC-1 cells.
Notes: Data are mean ± standard deviation (n = 3), *P < 0.05, **P < 0.01, and ***P < 0.001 vs control group, #P < 0.05, ##P < 0.01, ###P < 0.001 vs the same dose of free oridonin group.
Abbreviation: ORI, oridonin.

