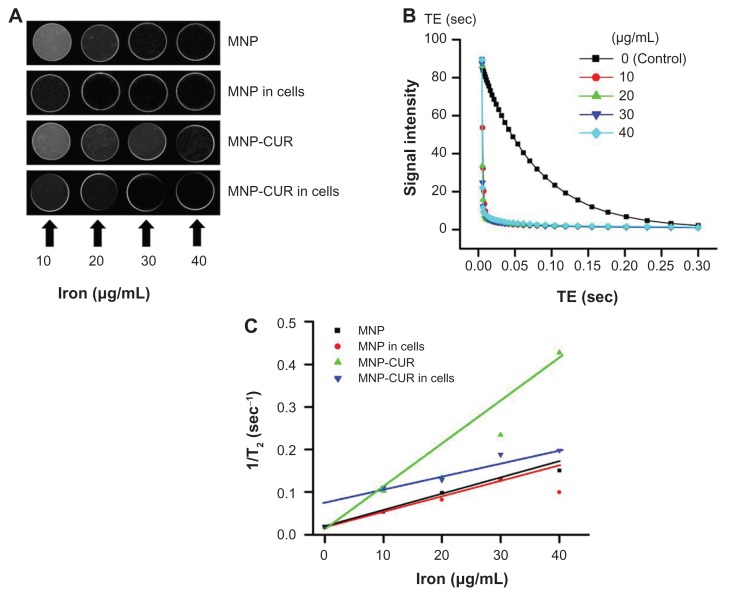
Figure 7.
In vitro magnetic resonance image characteristics of magnetic nanoformulations. (A) Signal intensity T2-weighted magnetic resonance images of magnetic nanoparticle formulation, magnetic nanoparticle formulation in MDA-MB-231 cancer cells, curcumin-loaded magnetic nanoparticle formulation, and curcumin-loaded magnetic nanoparticle formulation in MDA-MB-231 cancer cells in 3% phantom agar gel (10–40 μg/mL) scanned under a 9.4 T vertical bore magnetic resonance image scanner (Agilent Technologies, Santa Clara, CA) at 25°C. (B) T2 relaxation curves of magnetic nanoformulations in phantom agar gel. (C) T2 relaxation rate R2 (1/T2) plotted as a function of the iron concentration for magnetic nanoformulations.
Abbreviations: MNP, magnetic nanoparticle formulation; MNP-CUR, curcumin-loaded magnetic nanoparticle formulation; TE, echo time.

