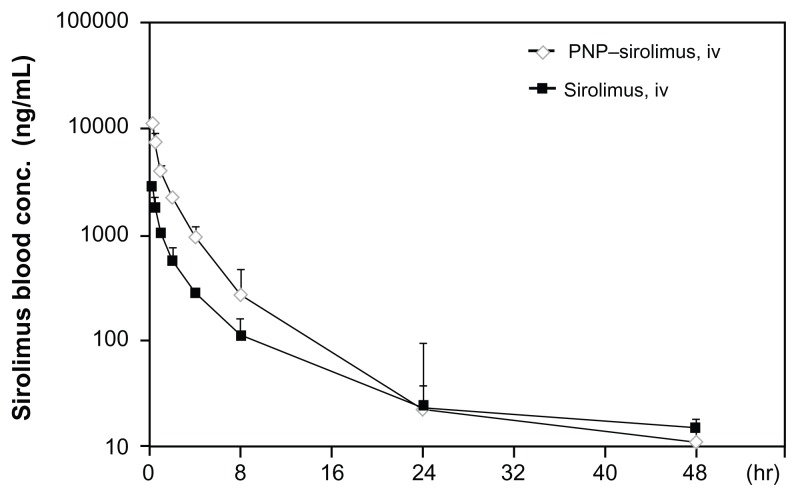
Figure 2.
Pharmacokinetic characterization of PNP–sirolimus.
Notes: Plasma concentration-time profiles were determined in Sprague–Dawley rats iv injected with sirolimus (solid square) or PNP–sirolimus (open diamond) at a dose of 10 mg/kg. Experimental points are the means of the observed plasma levels (mean ± SD, n = 3 per group).
Abbreviations: PNP, polymeric nanoparticle; iv, intravenous.

