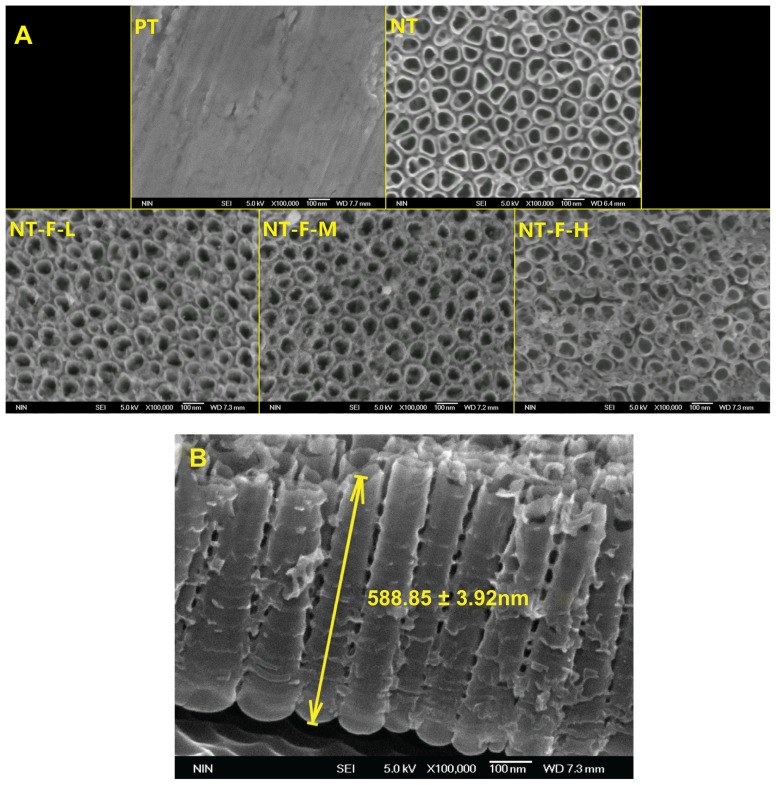
Figure 2.
Field emission scanning electron microscopy results. (A) NT surface showed an NT array structure; NT-F-H surface showed clumps of fibroblast growth factor 2 and that the typical NT surface was changed. (B) Profile of titania NT.
Note: The length of NT was 588.85 ± 31.92 nm (mean value ± standard deviation).
Abbreviations: NT, nanotube; PT, polished titanium.

