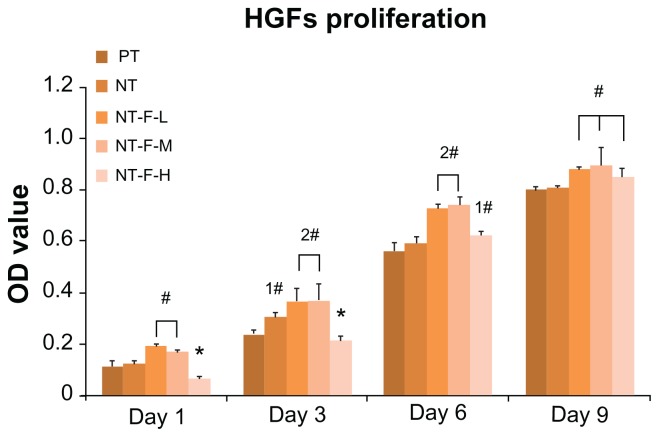
Figure 6.
Cell proliferation measured by the methyl-thiazolyl-tetrazolium assay. NT-F-L and NT-F-M showed the higher cell proliferation at each interval, whereas NT-F-H with overimmobilized FGF2 showed the lowest at the early stage (Days 1 and 3).
Notes: #Higher than PT (P < 0.01), *lower than PT (P < 0.01), significant difference exists between 1# and 2# (P < 0.01).
Abbreviations: FGF2, fibroblast growth factor 2; NT, nanotube; OD, optical density; PT, polished titanium.

