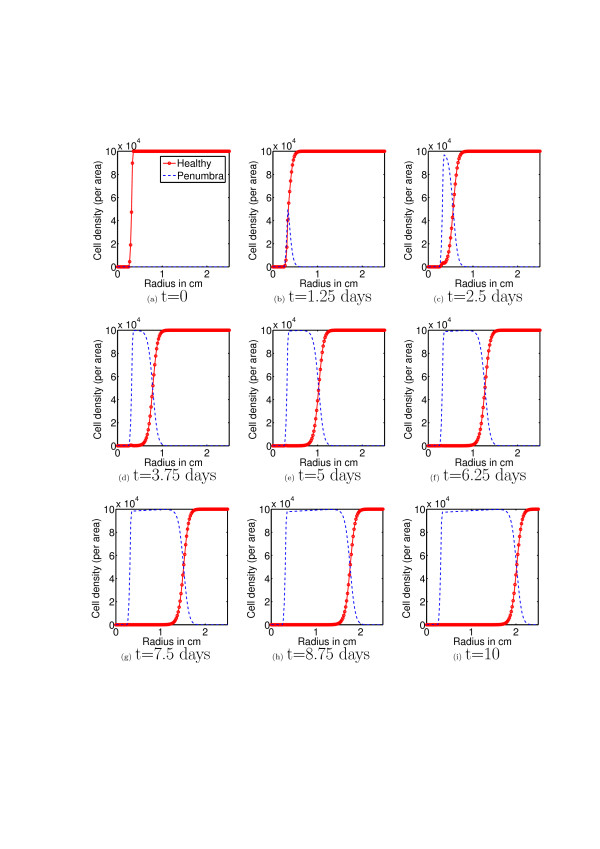
Figure 5.
Healthy and Penumbra cells without EPO. This figure shows the evolution of the healthy and penumbra (comprised of both catabolic and EPOR active) cell population densities over a period of 10 days. The results shown here correspond to a situation in which there is no production of or response to EPO. We see here that the healthy cell population is decimated. In accord with figure 4 and the corresponding mathematical model (equations (3-11)) this is due to the uninhibited influence of pro-inflammatory cytokines.

