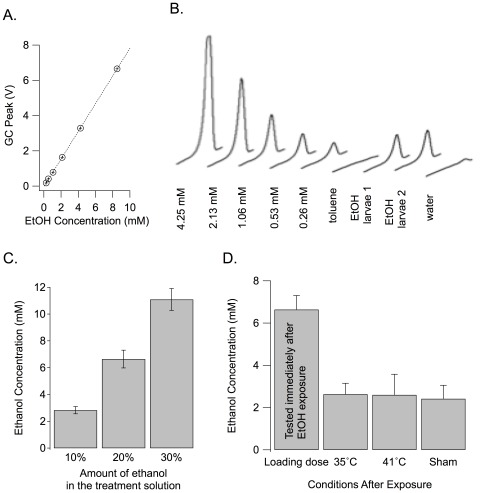
Figure 2. Perdurance of internal ethanol.
A. Example standard curve for ethanol gas chromatography. All of the measurements noted in this document fall within the linear range of the gas chromatograph standard curve. B. Chromatographs of ethanol from larvae. Standard responses for known concentrations of ethanol (4.25 mM, 2.13 mM, 1.06 mM, 0.53 mM, and 0.26 mM) diluted in toluene as well as pure toluene are shown. Representative traces from larvae treated for 20 minutes with 20% ethanol (EtOH larvae 1 and 2) or water (control larvae) are also shown. C. The amount of ethanol absorbed by larvae depended on the amount of ethanol in the treatment solution. D. The brief heat shocks (41°C and 35°C) that were used in the conditioning experiments did not reduce internal ethanol below that measured in sham-treated larvae. Animals were treated for 20 minutes with 20% ethanol (Loading Dose) and then taken through the heat shock protocol at 35°C or 41°C as used in conditioning experiments. The loading dose is the same data shown in the panel C 20% bar graph and is repeated for comparison purposes. Sham-treated animals were taken through same protocol except that they did not receive the heat shocks but instead were moved to room temperature (24°C) plates.

