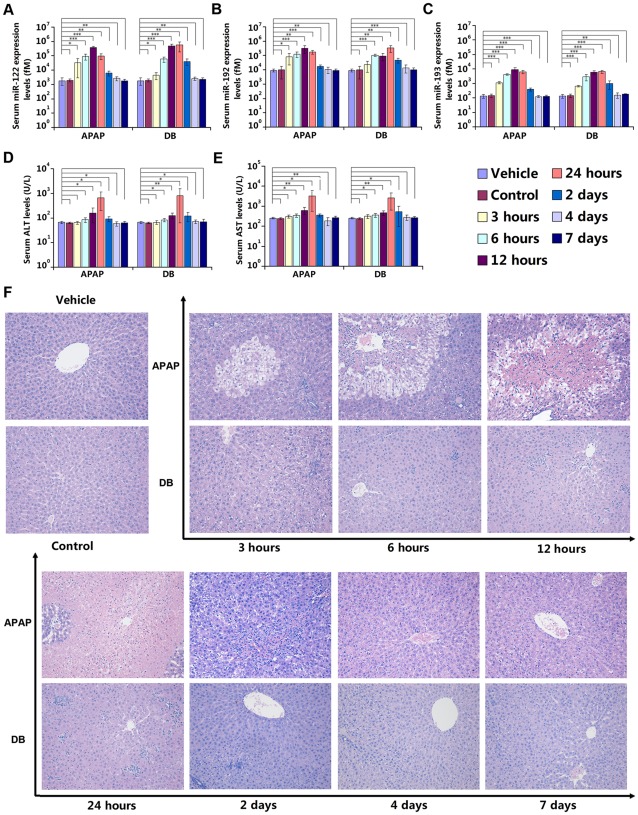
Figure 3. Time-dependent analysis of serum miRNAs compared with biochemical and histopathological parameters.
(A) Serum miR-122 expression levels; (B) Serum miR-192 expression levels; (C) Serum miR-193 expression levels; (D) Biochemical parameter: serum ALT levels; (E) Biochemical parameter: serum AST levels. The absolute concentrations of target miRNAs were calculated by referring to calibration curves developed with corresponding synthetic miRNA oligonucleotides. The data were presented as the means ± S.D. and student's t-test was used to determine the statistical significance of differences between vehicle group and other groups (*, P-values<0.05 versus vehicle; * *, P-values<0.01 versus vehicle; * * *, P-values<0.001 versus vehicle, n = 6). (F) Histopathological examination results, stained with hematoxylin and eosin, and examined by light microscopy, 200×. Ballooning degeneration appeared in central vein area 3 h after APAP administration, centrilobular necrosis turned out at 6 h and became heavier at 12 h. Hydropic degeneration appeared at 3 h after DB administration, followed by spotty and focal necrosis at 6 and 12 h. The histomorphological changes displayed a recovering manner from 2 d after administration.

