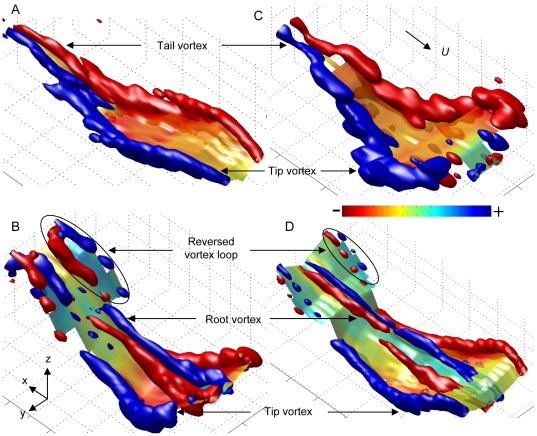
Figure 1. Wake topologies for one wingbeat of the studied species flying at 7 m/s.
The vorticity iso-surfaces (blue: +ωx iso; red: −ωx iso) show the main vortex structures, while the color-coded surface shows downwash w (see color bar). (A) Wake of pied flycatcher #1, ωx iso = ±50 s−1 and wmax = 1.7 m/s; (B) female Pallas' long-tongued bat with ωx iso = ±50 s−1 and downwash scale wmax = 2.1 m/s; (C) the blackcap, ωx iso = ±70 s−1 and wmax = 3.0 m/s; (D) female lesser long-nosed bat, ωx iso = ±45 s−1 and wmax = 2.4 m/s. The wind tunnel coordinate system {x,y,z} and freestream velocity vector U are in panel (B) and (C), respectively.

