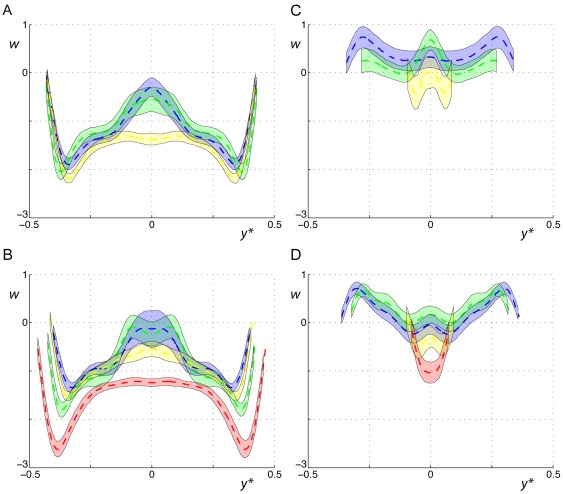
Figure 2. Spanwise downwash distributions at mid-downstroke and mid-upstroke for the studied species.
Spanwise downwash at mid-downstroke at 4 m/s (A) and 7 m/s (B) and mid-upstroke at 4 m/s (C) and 7 m/s (D), for the pied flycatcher (yellow), blackcap (red), Pallas' long-tongued bat (blue), and lesser long-nosed bat (green). The dotted lines show the average downwash for all measurements and the bars around the dotted lines are the sliding 95% confidence interval.

