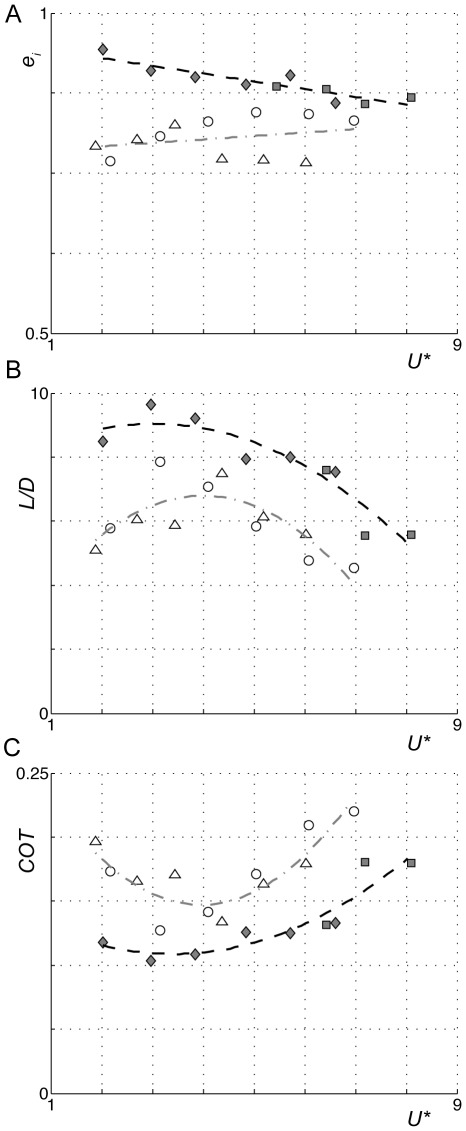
Figure 3. Flight efficiency factors throughout the measured normalized flight speed range for the studied species.
The different metrics are span efficiency ei (A); effective lift-to-drag ratio L/D (B); and the normalized mechanical cost-of-transport COT (C), for the pied flycatcher (filled diamonds), blackcap (filled squares), Pallas' long-tongued bat (open circles), and lesser long-nosed bat (open triangles). The trend lines are for birds (black dash) and bats (grey dot dash).

