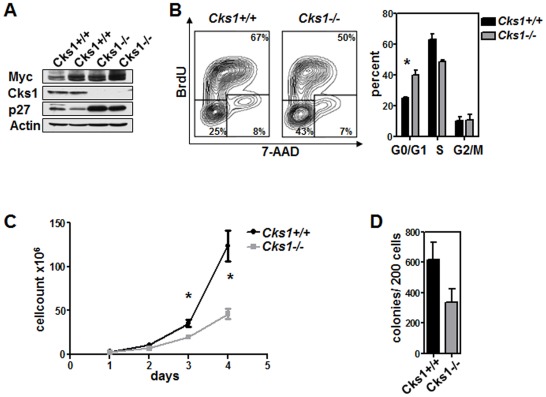
Figure 1. Cks1-deficient Eμ-Myc lymphomas display reduced proliferation and colony formation in vitro.
Primary Myc-induced lymphoma cells of the indicated Cks1 genotype were cultured in vitro until they were independent of stromal cell support. A, Immunoblot analysis of Myc, Cks1 and p27Kip1 protein levels, representative analysis. B, Left panel: Representative flow cytometry dot plot images of in vitro BrdU-labelled lymphoma cells of the indicated Cks1 genotype. Right panel: the bars represent the mean ± standard error of the mean of the indicated cell cycle phase. * indicates p<0.05. C, Growth curve of in vitro cultured lymphoma cells of the indicated Cks1 genotype. Cells were replated daily and the growth curve calculated based on the -fold increase in cell number starting with 1×10⁶ cells (day 1). The graph represents the mean ± standard deviation from 3 independent experiments. * indicates p<0.05. D, 200 Eμ-Myc lymphoma cells of the indicated Cks1 genotype were plated in methylcellulose. The number of colonies was counted on day 7. The graph represents the mean ± standard deviation from 2 independent experiments.

