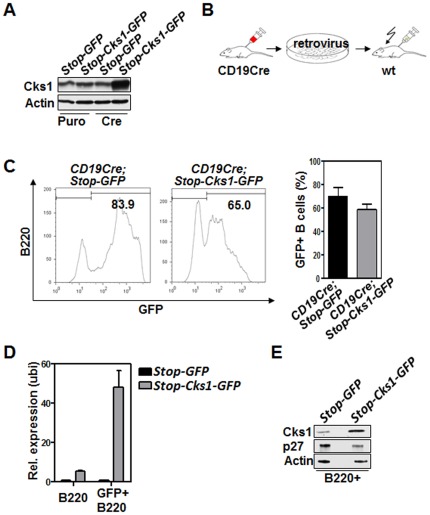
Figure 2. B cell-specific Cks1 overexpression results in elevated Cks1 protein levels.
A, Immunoblot analysis of Cre-mediated conditional expression of Cks1 in retrovirally infected NIH-3T3 shows the tightness of the translational stop-cassette. Retroviral infection was performed 3 times in 12 hour intervals with 8 µg/ml polybrene. B, Depiction of the murine bone marrow retroviral transduction-transplantation model. 5FU-stimulated bone marrow cells from CD19-Cre transgenic mice were infected 4 times with retrovirus and then intravenously injected into lethally irradiated wild type (wt) recipient mice. C, Flow cytometric analysis of engraftment of GFP-positive B cells in the peripheral blood 28 days after bone marrow transplantation. Left panel: Histogram upon B220 staining. Right panel: Results of two different transplantations are combined. The bars represent the mean ± standard error (n = 7 mice for Stop-GFP, n = 9 for Stop-Cks1-GFP). One experiment was performed with 2×10⁶ transplanted cells and an infection rate of 15% (GFP positivity, n = 4 or 5 recipient mice), and one with 1×10⁶ cells and an infection rate of 45% (GFP positivity, n = 2 or 3 recipient mice). D, realtime PCR analysis of Cks1 transcript levels in the indicated cells. Stop-GFP (n = 2), Stop-Cks1-GFP (n = 3). The bars represent the mean ± standard deviation. E, Immunoblot anaylysis of Cks1 protein levels in B220+GFP+ B cells. The B cells were FACS-sorted from n = 6 mice of each of the indicated treatment groups 50 days after transplantation.

