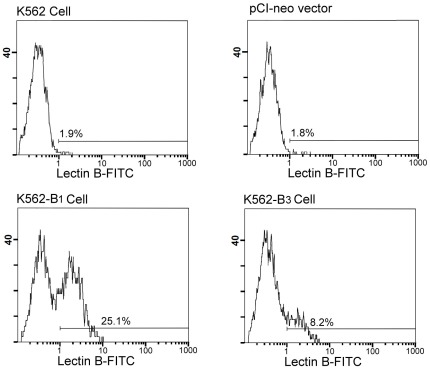
Figure 3. Flow cytometric analysis of B antigen expression.
The indicated cell lines were treated with sodium butyrate for 48 h to induce erythroid differentiation. The cells were then incubated with FITC-conjugated BS-I Isolectin B4 from Bandeiraea simplicifolia. Flow cytometric analyses were then performed to determine the levels of surface B antigen expression. Representative histograms for the indicated sublines were shown. The FITC-derived fluorescent intensity was displayed on the x-axis on a logarithmic scale and the number of cells on the y-axis.

