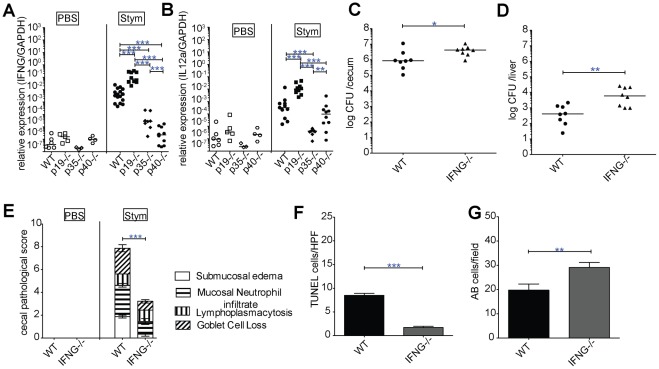
Figure 5. IL-23 inhibits Salmonella induced IL-12 dependent IFN-γ mediated inflammation.
(A) IFN-γ, and (B) IL-12a (IL-12p35) cecal gene expression at 3 d after oral WT Salmonella infection +/− mock treated mice from WT, p19−/−, p35−/−, p40−/− mice was determined by qPCR. Bars show the median and the data are pooled from 3 separate infections. (C) Cecum and (D) liver were collected from WT and IFN-γ−/− 3 days post infection. Organ homogenates were diluted and plated to determine CFU/organ. Bars represent the median bacterial load and the data are pooled from 2 separate infections. (E) Histologic changes were quantified on H&E-stained cecal sections as described in Fig. 2. (F) TUNEL and (G) AB positive cells were quantified per high-power field in the ceca of at minimum 3 infected mice/group. Results are expressed in mean ± SE. Statistical significance was determined using one way ANOVA followed by Bonferroni post test for A and B, the Mann-Whitney test was used for C and D, and unpaired Student's t-test was used for E-G. *: p<0.05, **: p<0.01, ***: p<0.001.

