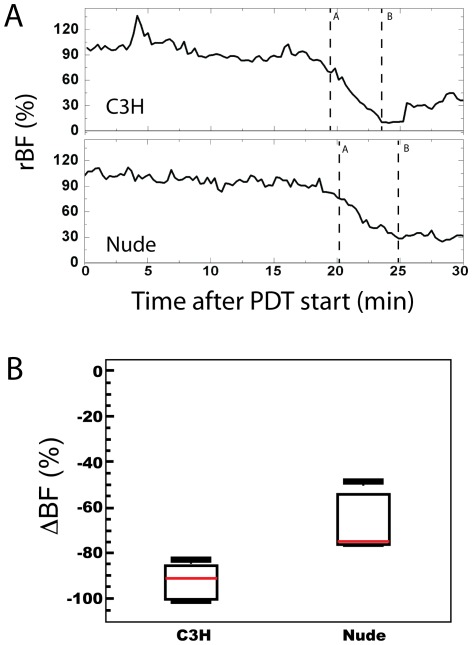
Figure 1. Strain-dependent differences in tumor blood flow during PDT.
(A) Representative rBF time-courses in RIF tumors for a C3H and a nude mouse during 30 minutes of illumination with PDT (t = 0). The lines A and B represent the change points marking the beginning of the decrease in rBF and the plateau in rBF level, respectively, and were used to define the change in rBF (i.e. ΔBF = rBFA−rBFB). (B) Box plots of blood flow changes (ΔBF) during PDT within animals of each strain (N = 7 for each strain); PDT decreased rBF in both groups (p = 0.016 for both C3H and nudes), with the decrease in C3H larger than that in nudes (p = 0.026).

