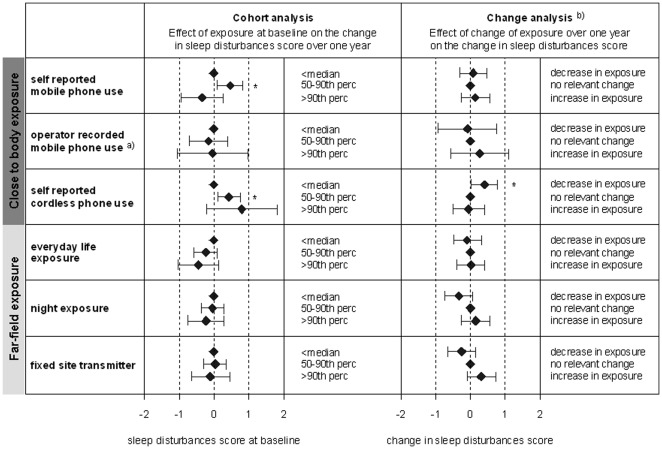
Figure 2. Results of the longitudinal analysis sleep disturbances: Diamonds refer to the change in sleep score and the horizontal lines mark the 95% confidence intervals.
An increase in score refers to an increase in sleep disturbances. * indicates statistical significance. Confounders see Fig. 1. a) for a subsample of 378 (235) subjects who consented that we receive data from the operator at baseline (follow-up). b) In the change analysis a decrease and increase in exposure refers to the participants with the 20% largest exposure decrease and increase between baseline and follow-up survey. No relevant change includes all other participants, who experienced a smaller or no change of exposure (reference group).

