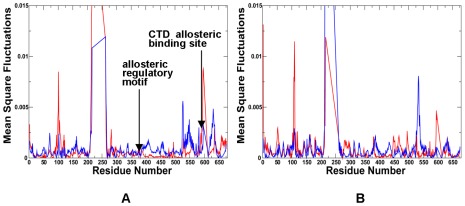
Figure 14. The Residue-Based Fluctuation Profiles of the Yeast Hsp90 Chaperone.
The NMSF residue profiles derived from PCA of all-atom MD simulations along the lowest frequency mode (A) and the second lowest mode (B). The profiles are shown for the monomer 1(in blue) and monomer 2 (in red). Each monomer in the yeast Hsp90 crystal structure is formed by the NTD (residues 2–215), M-domain (residues 262–526) and CTD (residues 527–676). The conserved regulatory and recognition sites are annotated and pointed to by arrows.

