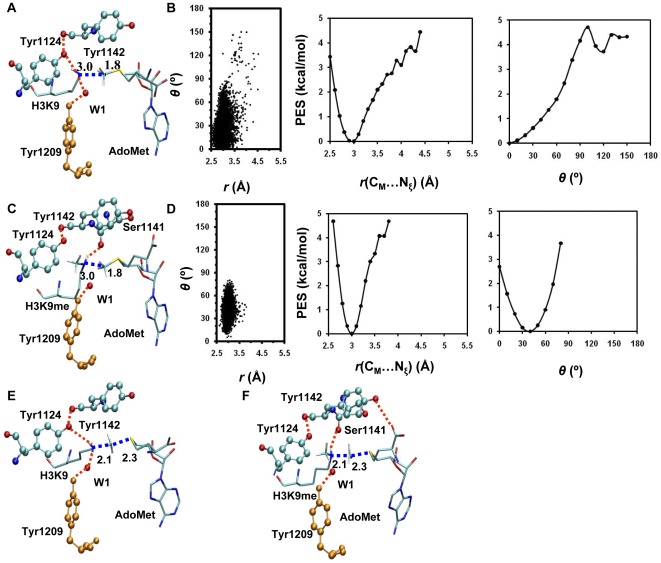
Figure 3. MD results for the F1209Y mutant.
(A) A representative active-site structure along with the average values of some structural parameters of the reactant complex for the first methyl transfer. (B) Left: the two-dimensional plot of r(CM…Nζ) and θ distributions of the reactant complex for the first methyl transfer; Middle: the free-energy change as a function of r(CM…Nξ) obtained from the distributions; Right: the free-energy change as a function of θ obtained from the distributions. (C) The structure of the reactant complex for the second methyl transfer. (D) Left: the two-dimensional plot of r(CM…Nζ) and θ distributions of the reactant complex for the second methyl transfer; Middle: the free-energy change as a function of r(CM…Nξ) obtained from the distributions; Right: the free-energy change as a function of θ obtained from the distributions. (E) The structure near the transition state for the first methyl transfer. (F) The structure near the transition state for the second methyl transfer.

