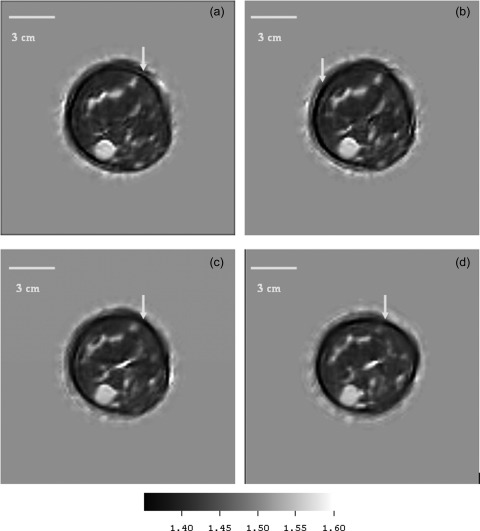
Figure 6.
(Color online) Patient p02: Simple cyst speed images at successive levels, 1.5 mm apart. The cyst is clearly visible at the 7 o’clock position in all levels. These very early images show dark artifacts near skin (see arrows) caused by inappropriate starting guesses. The volunteer had no history of disease and the speeds of sound (and std. devs) of the cyst at each level were 1552 (10); 1550 (13); 1545 (9); 1547 (7) m/s. The fat had a speed of 1400–1411 m/s.

