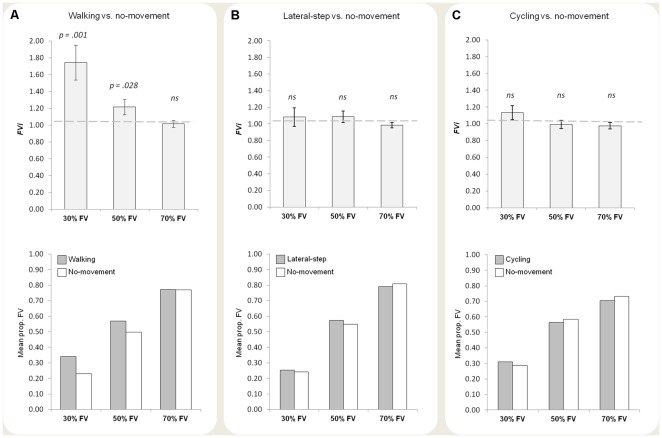
Figure 2. Results of the three experiments.
(A) Experiment 1: walking condition vs. no-movement condition (N = 24). Upper panel. Plot of the FVi for the three perspective levels (30%, 50%, and 70% FV). The dashed line at 1 corresponds to the case in which FV responses were equally frequent in the walking condition and in the no-movement condition. Values greater than one indicate that FV responses were more frequent in the walking condition compared to the no-movement condition. Bars indicate standard errors. Lower panel. Mean proportion of FV responses in the walking condition (gray bars) and the no movement condition (white bars). (B) Experiment 2: lateral-step condition vs. no-movement condition (N = 25). Upper panel. FVi was not significantly different from one for any of the perspective levels. Lower panel. Mean proportion of FV responses in the lateral step condition (gray bars) and the no movement condition (white bars). (C) Experiment 3: cycling condition vs. no-movement condition (N = 24). Upper panel. FVi was not significantly different from one for any of the perspective levels. Lower panel. Mean proportion of FV responses in the cycling condition (gray bars) and the no movement condition (white bars).

