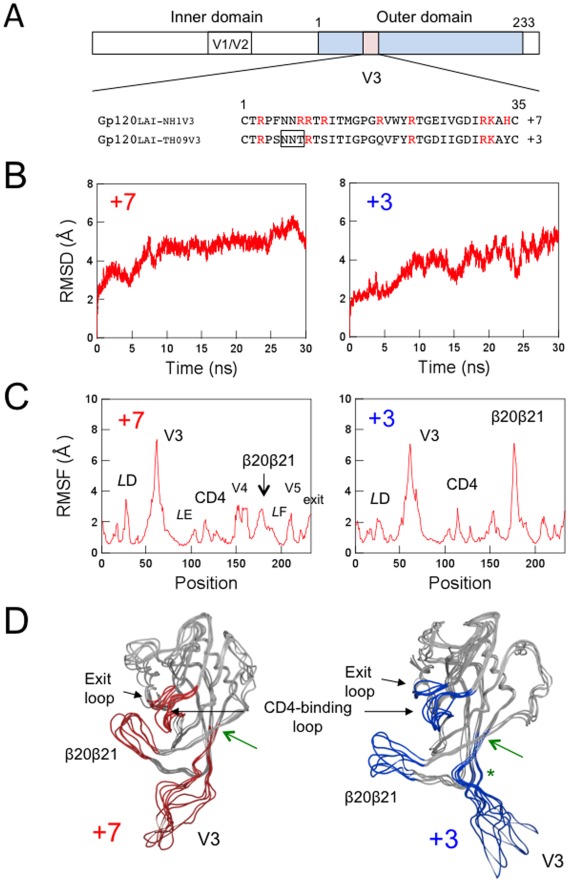
Figure 1. MD simulation of the identical gp120 outer domain carrying a V3 loop with net charge of +7 or +3.
(A) Schematic representation of the gp120 open reading frame along with the amino acid sequences. The net charge indicates the number of positively charged amino acids (R, K, and H) minus the number of negatively charged amino acids (D and E) in the V3 loop. A light blue box indicates the outer domain used for the MD simulations. A pink box indicates the V3 loop. The numbers indicate amino acid positions at the outer domain (amino acids 1 to 233 in Figure 1A correspond to amino acids 256 to 489 in the gp120 of HIV-1LAI) or the V3 loop. An open black box in the V3 loop sequence indicates a potential site for the N-linked glycosylation. (B–D) Left panels: Gp120LAI-NH1V3; Right panels: Gp120LAI-TH09V3. +7 and +3 indicate the net charges of V3 loops of the recombinant proteins. (B) Time course of RMSD during MD simulations. The RMSD values indicate the structural fluctuations of the outer domain in aqueous solution. The numbers in the horizontal axes indicate the time of MD simulation. (C) Distribution of RMSF in the gp120 outer domain. The RMSF values indicate the atomic fluctuations of the main chains of individual amino acids during 10–30 ns of MD simulations. The numbers in the horizontal axes indicate amino acid positions at the outer domain. (D) Superimposition of Gp120 models at 10, 15, 20, 25, and 30 ns of MD simulation. A green asterisk indicates approximate position of a potential N-glycosylation site at the V3 stem. A green arrow indicates the site of the disulfide bond at the V3 base.

